Imagine two brand-new solar modules rolling off a production line. To the naked eye, they are identical—flawless, powerful, and ready to generate clean energy for decades. They both pass the same standard quality checks with flying colors. Yet, five years out in the field, one is performing perfectly while the other is plagued by internal corrosion, its power output in steady decline.
What went wrong? The answer often lies with a silent killer: moisture. Tiny, invisible water molecules that sneak past the module’s defenses and slowly degrade its internal components.
The traditional way to test for this weakness involves subjecting a module to weeks of intense „damp heat“ testing—a brutal, accelerated simulation of a lifetime in a harsh climate. But this is a reactive measure. It tells you if a module failed, but not always why or, more importantly, how you could have predicted it from the very beginning.
What if the secret to a module’s long-term resilience wasn’t just hidden in a final stress test, but was broadcasting itself during the first few minutes of its creation?
The Unseen Enemy: Why Moisture Ingress Matters
Moisture ingress is the process of water vapor gradually penetrating the protective layers of a solar module. While it sounds simple, its consequences are anything but. Once inside, moisture can trigger a cascade of failures:
- Corrosion: It corrodes the delicate metal fingers and ribbons that collect electricity from the solar cells, disrupting the flow of energy.
- Delamination: It can cause the layers of the module—glass, encapsulant, and backsheet—to separate, creating bubbles and pathways for even more moisture to enter.
- Power Loss: Both corrosion and delamination lead to a measurable and often irreversible drop in the module’s power output.
The primary lines of defense against this invasion are the module’s backsheet (the rearmost protective layer) and the edge sealant (the material used to seal the perimeter). The quality and compatibility of these materials are critical to ensuring a 25+ year lifespan.
The Old Way: Waiting for a Failure to Happen
For decades, the industry has relied on Damp Heat (DH) testing to qualify module designs. In a DH test, a module is placed in a chamber at 85°C and 85% relative humidity for 1,000 hours or more. After this „torture test,“ engineers use tools like Electroluminescence (EL) imaging to look for damage.
EL imaging works like an X-ray for solar cells, revealing micro-cracks and areas that are no longer electrically active. When moisture gets in, the resulting corrosion often makes parts of the cell go dark in an EL image, leaving a clear visual footprint of the damage.
In this EL image, the dark, cauliflower-like patterns creeping in from the edges are a classic sign of moisture-induced corrosion after a damp heat test.
While essential, this method has a fundamental limitation: it’s a pass/fail verdict delivered at the end of a long and expensive process. It doesn’t provide the early, predictive data needed to choose the right materials in the first place.
The Predictive Power of the Lamination Process
Here’s the „aha moment“: the way a module behaves during its lamination cycle holds powerful clues about its future susceptibility to moisture.
Lamination is the process where the module sandwich—glass, encapsulant, cells, and backsheet—is heated and pressed under vacuum to form a single, solid unit. During this process, any residual moisture trapped within the layers turns into vapor and tries to escape. This is where the magic happens.
By placing highly sensitive humidity sensors inside the laminator, we can listen to what the module is „exhaling.“ The data reveals a fascinating story about the materials being used.
Listening to What Your Materials Are Telling You
Here’s what our applied research at PVTestLab has shown:
-
Moisture Has to Go Somewhere: During the heat of the solar module lamination process, trapped water vapor will push outwards towards the edges of the module.
-
The Escape Route is Key: The edge sealant and backsheet materials act as gatekeepers. Some materials have a higher water vapor transmission rate (WVTR), meaning they are more „breathable“ and allow this vapor to escape easily. Others are more impermeable, trapping the vapor inside.
-
A Humidity Spike Tells the Tale: A material combination that allows moisture to escape will produce a significant, sharp spike on the in-lamination humidity sensor. A combination that traps moisture will show a much smaller, flatter curve.
This graph compares the outgassing behavior of two material sets. Material A (blue line) shows a high humidity peak, indicating it effectively expels moisture during lamination. Material B (orange line) shows a very low peak, meaning it traps moisture inside.
This leads to a crucial insight: A material combination that is poor at letting moisture out during lamination is often also poor at keeping moisture out during its operational life.
The low, flat curve of Material B is an early warning sign. It indicates that the material is creating a tight, impermeable seal right away, trapping residual process moisture. This trapped moisture can be the seed for future corrosion. Conversely, the high peak of Material A shows it allows the module to „exhale“ completely before the final cure, resulting in a drier, more stable internal environment.
Creating a Moisture Ingress Risk Index
By correlating this predictive lamination data with traditional post-DH test EL results, we can move beyond a simple pass/fail verdict to quantitatively ranking material performance.
This approach allows us to build a Moisture Ingress Risk Index: a simple, data-driven benchmark combining two key datasets:
- Lamination Outgassing Data: How high was the humidity peak? (Higher is better).
- Post-DH Test EL Analysis: How severe was the moisture ingress? (Less is better).
A material that produces a high humidity peak during lamination and shows minimal damage in the EL image after damp heat testing receives a low-risk score. A material that produces a low humidity peak and shows significant EL damage receives a high-risk score.
This approach is incredibly valuable for anyone involved in prototyping new solar module designs. It transforms material selection from a game of trial and error into a strategic, data-backed decision.
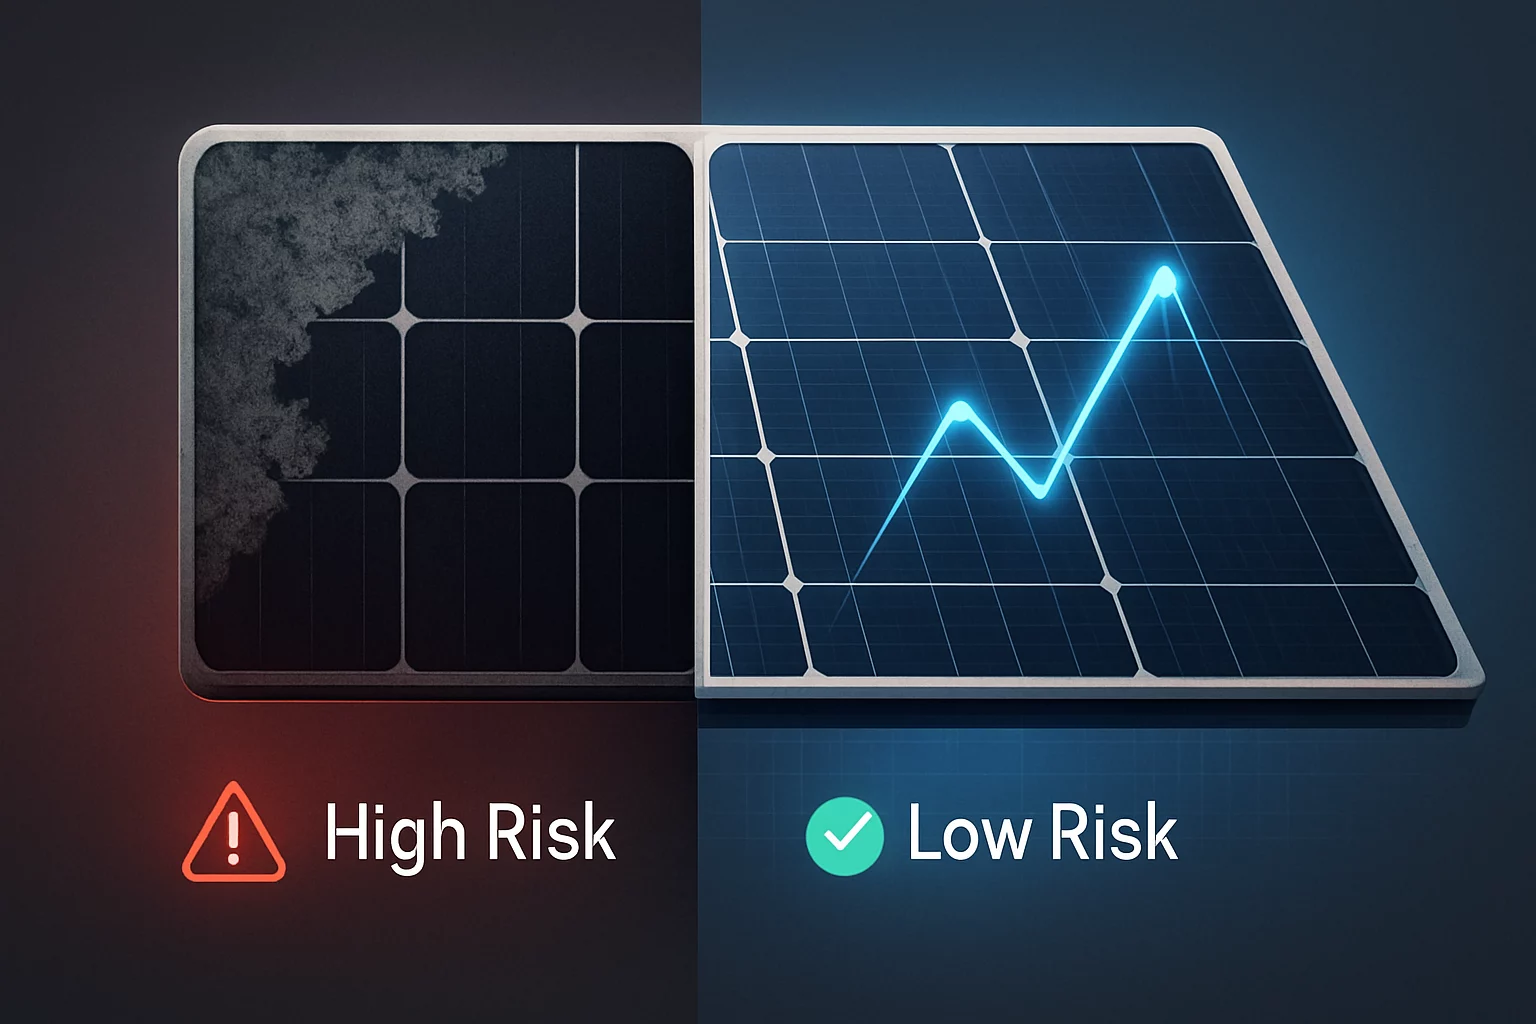
This index clearly shows the correlation. Sealant A had excellent outgassing, passed the DH test flawlessly, and earned a „Low Risk“ rating. Sealant C, with poor outgassing, showed severe defects and was flagged as „High Risk.“
FAQ: Your Questions Answered
Is some moisture inside a module normal?
Yes, it’s nearly impossible to assemble a module in a completely moisture-free environment. The key isn’t eliminating 100% of moisture, but rather selecting materials that can effectively expel it during lamination and robustly block it from entering later.
Does this predictive method replace damp heat testing?
Not at all. It complements it. Think of it as a smart screening tool. By using in-lamination sensor data, you can quickly benchmark a dozen different edge sealants or backsheets and select the top two or three most promising candidates for full, time-consuming damp heat certification. It saves significant time and R&D costs.
Can this method be used to test other materials besides edge sealants?
Absolutely. This data-driven approach is ideal for any material testing for solar modules, including comparing different backsheets, encapsulants (like EVA and POE), and even glass coatings. It provides a holistic view of how the entire material stack interacts.
How does production temperature or environment affect the sensor readings?
That’s why this testing must be done in a controlled, industrial environment. At PVTestLab, the entire production area is climate-regulated to ensure that the results are repeatable and directly comparable, removing external variables so only material performance is measured.
What is the single biggest takeaway for module developers?
The lamination process is not just a manufacturing step; it is your first and best opportunity to gather predictive data about the long-term reliability of your module. The data is there—you just need the right tools to listen.
From Insight to Action
Understanding this hidden conversation between your materials and your process is the first step toward building more reliable, durable, and profitable solar products. The traditional approach of waiting for a stress test to reveal a fatal flaw is no longer enough in a competitive market.
By leveraging predictive analytics straight from the laminator, manufacturers and innovators can de-risk new designs, validate supplier claims with objective data, and gain the confidence that their products will not just survive, but thrive for decades to come.