As a solar module developer, you’re presented with a new, cost-effective encapsulant. On paper, the specs are fantastic—promising durability, excellent adhesion, and faster processing. But a critical question remains: how will it actually perform after 15, 20, or even 25 years under the high voltages and relentless sun of a real-world solar farm?
A hidden flaw in that material could lead to catastrophic field failures years down the line, long after the modules have shipped. This uncertainty is one of the greatest risks in solar manufacturing. But what if you could look into the future—what if you could measure a key property of the raw material to accurately predict its long-term stability?
At PVTestLab, we’ve turned that „what if“ into a reliable, data-driven process. We have established a direct correlation that acts as an early warning system for one of the most silent and destructive failure modes in PV modules: Potential Induced Degradation (PID).
What is PID, and Why Should You Care?
Potential Induced Degradation (PID) is like a slow, invisible electrical leak. In large solar arrays, a high voltage potential can build up between the solar cells and the module’s grounded frame. Without proper insulation, this difference can cause tiny electrical currents to leak from the cells, through the encapsulant and glass, to the frame.
This leakage isn’t just wasted energy—it actively degrades the solar cells, permanently reducing their ability to generate power. Over months and years, this can lead to significant power loss across an entire solar plant, jeopardizing financial returns and triggering costly warranty claims. Often, the culprit is an encapsulant that simply couldn’t withstand long-term electrical stress.
The Unsung Hero: The Electrical Role of the Encapsulant
We typically think of an encapsulant like EVA (Ethylene Vinyl Acetate) or POE (Polyolefin Elastomer) as a protective laminate that holds the module together, cushions the cells, and seals out moisture. But its most critical and often overlooked job is to act as a powerful electrical insulator.
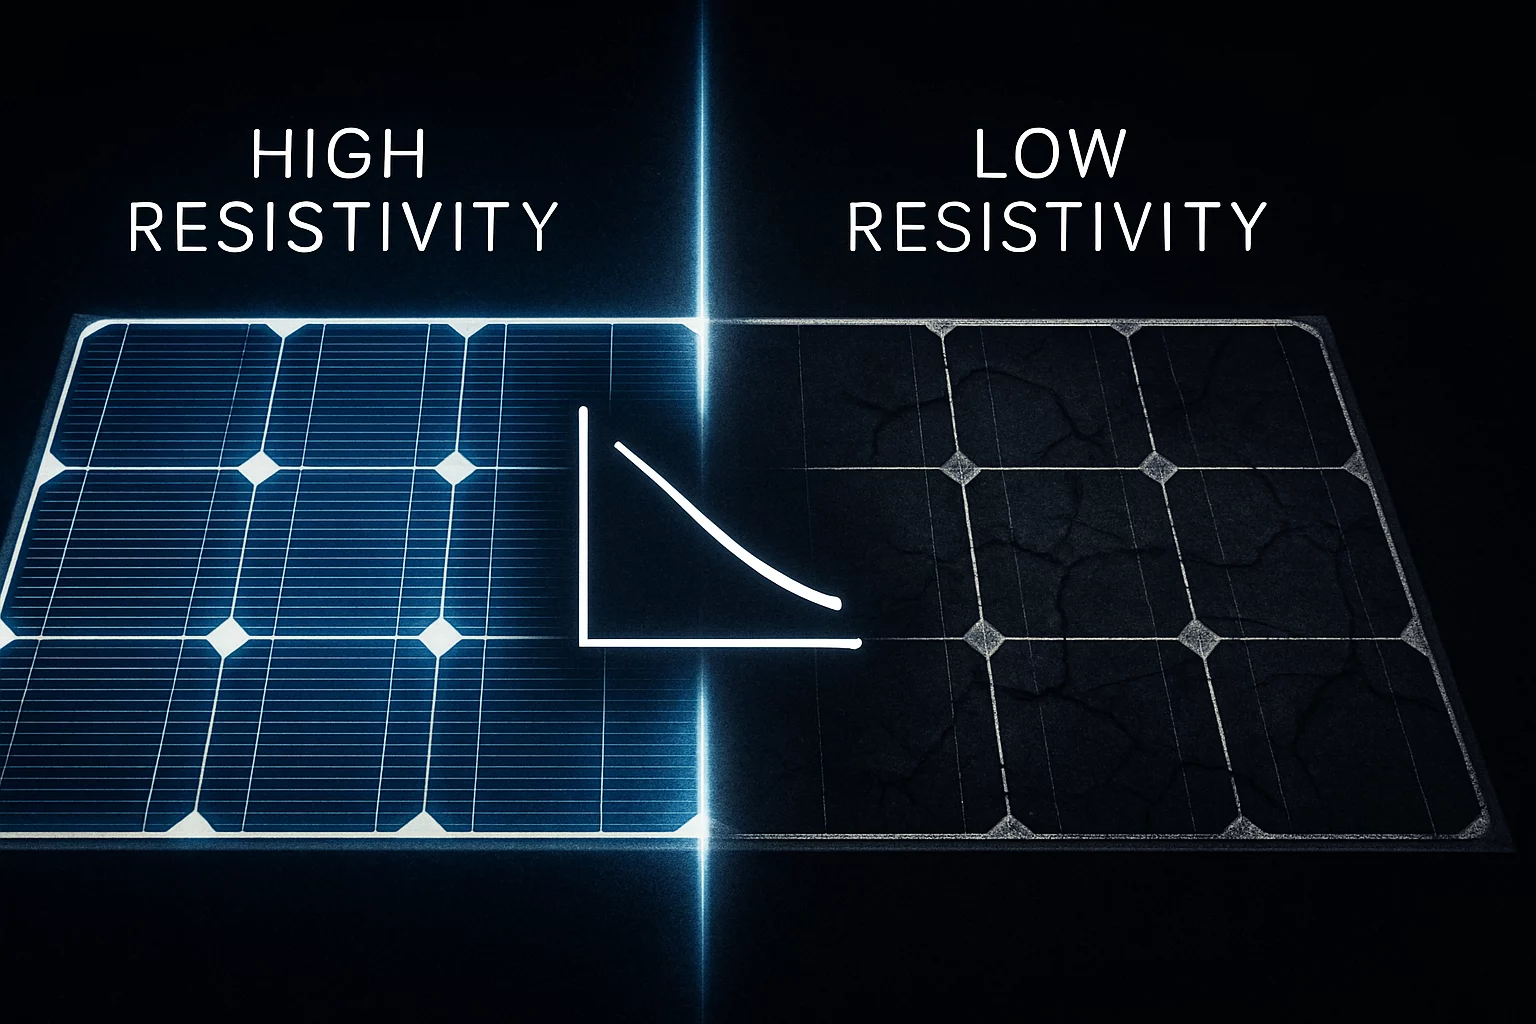
This insulating property is measured by a characteristic called volume resistivity. In simple terms, volume resistivity is a material’s inherent ability to resist the flow of an electrical current. An encapsulant with high volume resistivity acts like a strong, impenetrable barrier, preventing the damaging leakage currents that cause PID. One with low resistivity is like a leaky dam, allowing degradation to set in over time.
The Challenge: Moving Beyond a Simple Pass/Fail
So, how do manufacturers traditionally check for PID resistance? The standard method involves building a full-size module, placing it in a climate chamber, and subjecting it to harsh conditions (typically 85°C, 85% relative humidity, and -1000 volts) for several hundred hours. At the end, you measure the power loss. If it’s below a certain threshold (e.g., 5%), it „passes.“
This conventional approach has major drawbacks:
- Slow and Expensive: Fabricating and testing full modules takes weeks, if not months.
- Not Comparative: A „pass“ reveals nothing about the performance margin. Did the material pass by a mile or just barely scrape by? This makes it impossible to effectively rank different materials.
- Reactive, Not Predictive: Problems are only discovered after you’ve already invested significant time and resources into building the module.
This black-box testing leaves innovators in the dark, unable to de-risk new materials early in the development cycle without a faster, more insightful method.
Our Breakthrough: Creating a Predictive PID Resistance Factor
Frustrated by the limits of the traditional pass/fail system, our process engineers searched for a leading indicator of PID performance. Our hypothesis was simple: an encapsulant’s initial, pre-lamination volume resistivity should directly correlate with its power stability after stress testing.
To prove this, we developed a systematic, multi-step validation process:
- Baseline Material Characterization: We start by measuring the volume resistivity of various raw encapsulant foils before they are ever heated or laminated. This gives us a pure, baseline electrical signature for each material.
- Controlled Prototyping: We then use these different encapsulants to produce identical, high-quality mini-modules. By using a single, highly controlled full-scale R&D production line, we eliminate manufacturing variables, ensuring that any performance differences are due solely to the encapsulant material itself.
- Accelerated PID Stress Testing: The finished mini-modules are subjected to a standardized, aggressive PID test in our advanced climatic chambers.
- Data Correlation and Analysis: After the test, we measure the final power loss for each module. The critical step is plotting the initial volume resistivity of each raw encapsulant against the final power loss of its corresponding module.
The result is a clear and undeniable correlation: materials with higher initial volume resistivity consistently show significantly lower power loss after PID stress testing.
This data allows us to create a „PID Resistance Factor“—a benchmark that transforms a simple material measurement into a powerful predictor of long-term field performance.
What This Means for You: From Guesswork to Data-Driven Decisions
This predictive model fundamentally changes how both material suppliers and module manufacturers operate.
For material manufacturers, it provides a rapid screening tool to test new formulations in days, not months. You can approach customers with hard data that quantifies the PID resistance of your product.
For module developers, this method removes the guesswork from material selection. Instead of relying on supplier datasheets or lengthy internal testing, you can use a quick resistivity measurement to rank potential encapsulants and de-risk your bill of materials. This allows you to innovate faster and with greater confidence, long before committing to expensive, large-scale production runs. This is a core part of our material testing and lamination trials.
A Real-World Example
Imagine a client comes to us with two new POE encapsulants they are considering for a next-generation bifacial module.
- Encapsulant A has a very high initial volume resistivity.
- Encapsulant B has a resistivity that is an order of magnitude lower.
Based on our model, we predict that Module A will be highly resistant to PID, while Module B is at high risk of degradation. We build the modules and run them through our accelerated PID test.
The results from the electroluminescence (EL) inspection were stark. The module made with Encapsulant A showed no degradation. In contrast, the module made with Encapsulant B revealed massive dark areas, indicating widespread cell inactivation and a catastrophic power loss of over 30%.
Our predictive factor was confirmed. The client could confidently move forward with Encapsulant A, having avoided a potential multi-million-dollar mistake and saved months of qualification time.
FAQ: Understanding Encapsulants and PID Resistance
What’s the difference between EVA and POE for PID resistance?
Generally, POE has a much higher intrinsic volume resistivity than traditional EVA. This is why POE is often the preferred choice for high-voltage and high-efficiency modules (like N-type and bifacial) where PID risk is a major concern.
Can additives affect an encapsulant’s resistivity?
Absolutely. Additives like UV blockers, stabilizers, or cross-linking agents can significantly alter the electrical properties of the base polymer. This is why it’s crucial to test the final formulation, not just the raw polymer.
How does this process compare to traditional testing timelines?
Measuring the volume resistivity of a raw material takes hours. Building and stress-testing a full module takes weeks or months. By front-loading the analysis, we can screen dozens of materials in the time it would take to conduct one traditional pass/fail test, providing far more valuable, comparative data.
Is volume resistivity the only factor that matters for PID?
No, but it is one of the most critical. Other factors like the type of solar cell, the soda-lime content of the glass, and environmental conditions (temperature and humidity) also play a role. However, the encapsulant serves as the primary defensive barrier, and if its resistivity is too low, no other component can fully compensate.
The Path to Predictable Performance
Leaving the long-term reliability of your solar modules to chance is an unnecessary risk. The foundation for a 25-year lifespan is built on the intrinsic properties of the materials you choose today. By understanding and quantifying a key predictor like volume resistivity, you can shift from a reactive approach to a proactive, data-driven strategy.
Building durable, high-performance solar modules begins with a deep understanding of how materials and processes interact. Ready to replace pass/fail testing with predictive analysis? Explore how our process optimization and validation services can help you build more reliable solar modules from the ground up.
„By linking a fundamental material property like resistivity to real-world degradation, we’re replacing uncertainty with predictable outcomes. It’s about giving developers the data they need to innovate confidently.“
– Patrick Thoma, PV Process Specialist at PVTestLab