Your laminator’s temperature log looks perfect. Every data point from the last shift sits comfortably between the upper and lower control limits. The process is stable, right?
Maybe not.
While every point might be „in-spec,“ a hidden trend could be developing—a silent shift in your process subtly pushing you toward delamination, bubbles, or incomplete curing. This is the frustrating reality for many solar module manufacturers: a process can be statistically „in control“ but still be on a path to failure.
Industry analysis shows that up to 15% of module delamination issues can be traced back to subtle, „in-spec“ process drifts that went unnoticed for weeks. You’re not seeing alarms, but latent defects are forming—problems that will only appear after the module has left your factory.
The Illusion of Control: When „Good Enough“ Isn’t
For decades, Statistical Process Control (SPC) has relied on a simple rule: if a data point falls outside the control limits (typically three standard deviations from the mean), the process needs attention. It’s a powerful tool for catching major deviations, but it’s blind to the more subtle, non-random patterns that signal impending trouble.
A process trending upward, even while all points remain within the limits, isn’t truly stable—it’s a clear warning that a variable has changed.
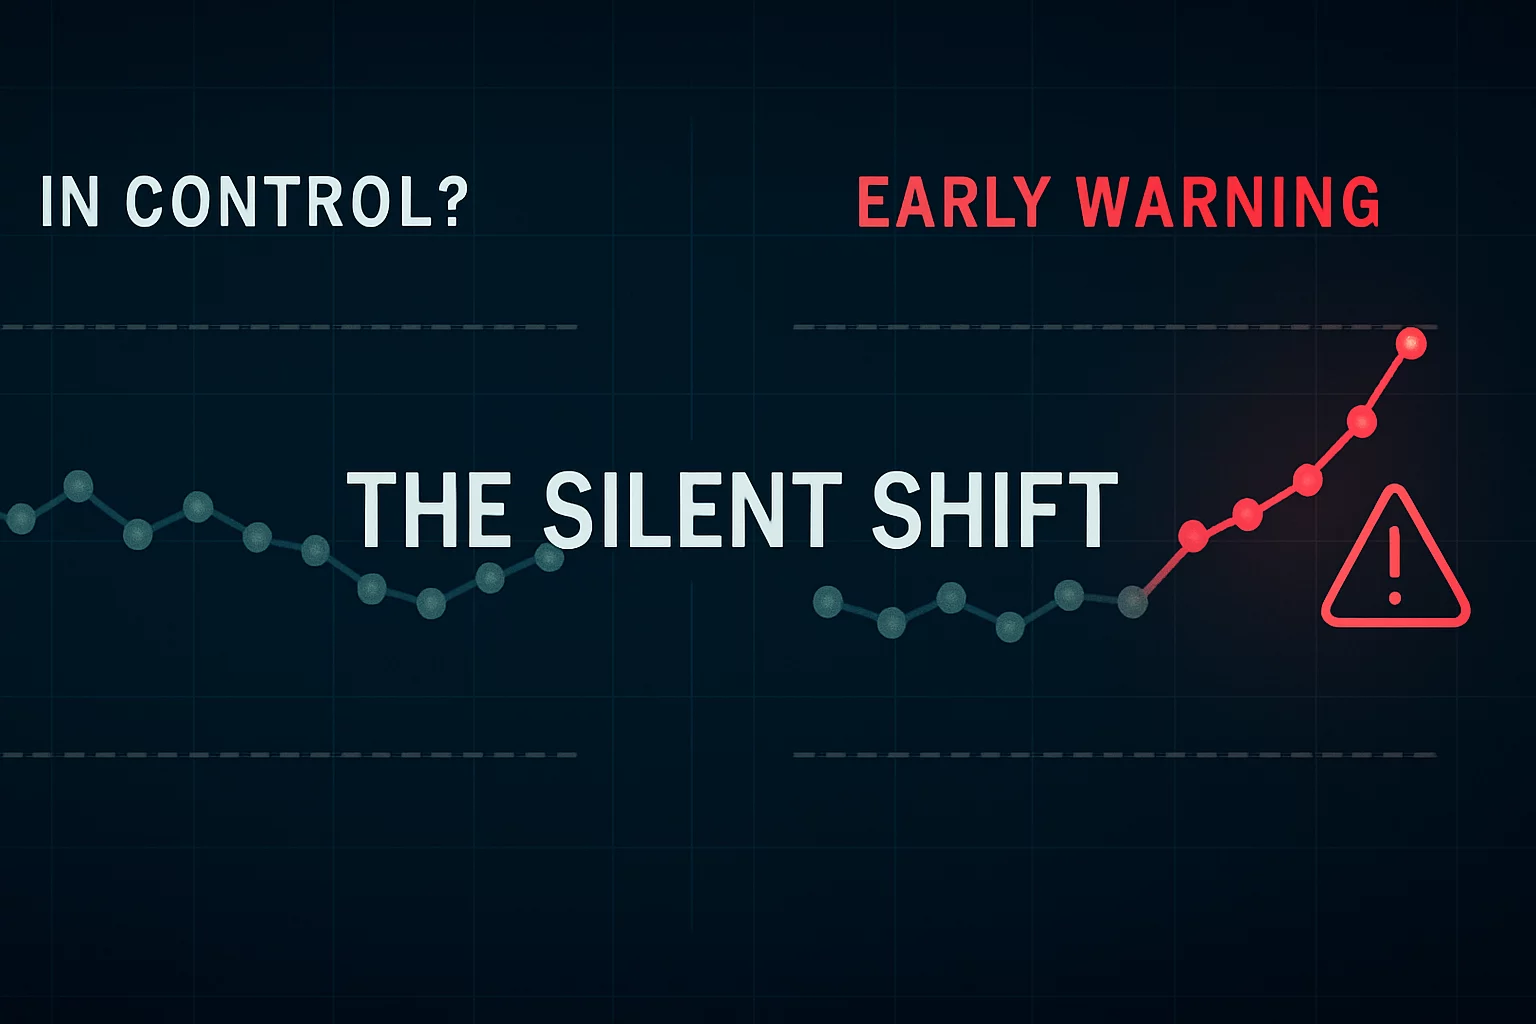
Relying only on control limits is like waiting for the smoke alarm to go off when you could have smelled something burning minutes earlier. In solar module lamination, where temperature, pressure, and time are absolutely critical, these early warnings are invaluable.
A Smarter Way to Listen to Your Data: Introducing the Nelson Rules
In the 1980s, quality control expert Lloyd S. Nelson expanded on the foundational work of Walter Shewhart, developing a set of tests for detecting non-random behavior in a process. These „Nelson Rules“ give us a language to interpret the story our data is telling.
Think of it this way: if you flipped a coin ten times and it landed on heads every single time, you wouldn’t just say, „Well, heads is a possible outcome.“ You’d rightly suspect the coin is biased. Nelson Rules apply that same intuitive logic to your production data, helping you spot a „biased“ or unstable process long before it produces a defect.
Putting the Rules into Practice: Three Early-Warning Signals for Lamination
While there are eight official Nelson Rules, you can gain powerful insights by focusing on just a few that are particularly relevant to thermal processes like encapsulant curing.
- The Trend (Rule 1): Six or more points in a row continually increasing or decreasing.This is one of the most critical patterns to watch for in a laminator.
- What it looks like: A clear, steady slope on your run chart.
- What it could mean: A heating element is slowly degrading, a thermocouple is drifting out of calibration, or even a seasonal change in ambient factory temperature is affecting your process. This makes it a vital factor to investigate during encapsulant lamination trials to ensure your new material performs consistently.
- The Shift (Rule 2): Nine or more points in a row on the same side of the average line.This signals that something fundamental in your process has changed.
- What it looks like: A sudden jump where data points „hug“ one side of the centerline.
- What it could mean: An operator made an unrecorded adjustment to a setting, a new batch of EVA or POE with slightly different thermal properties was introduced, or a vacuum pump’s performance has changed.
- The Pattern (Rule 3): Fourteen or more points in a row alternating up and down.This pattern, known as oscillation, often indicates an over-correction problem.
- What it looks like: A sawtooth or zig-zag pattern.
- What it could mean: The laminator’s PID controller (which regulates temperature) may be „hunting“ for the setpoint, overshooting and then undershooting. While the average temperature might seem correct, these rapid fluctuations can lead to inconsistent curing.
From Data Points to Decisions: The Real-World Impact
Applying Nelson Rules transforms your process monitoring from a reactive task into a proactive strategy.
- Prevent Costly Defects: By catching a temperature trend early, you can schedule maintenance before you produce a week’s worth of modules with under-cured encapsulant. It’s a shift from expensive, reactive problem-solving to low-cost, proactive process management.
- Improve Material Validation: When you’re testing a new encapsulant or backsheet, these rules help you distinguish between normal process variation and a genuine material-process incompatibility. This depth of analysis is essential for successful solar module prototyping.
- Build Deeper Process Knowledge: Consistently identifying these patterns helps your engineering team understand the subtle behaviors of your equipment and materials, leading to more robust and reliable production lines.
„Standard control charts tell you if you’ve crashed. Nelson Rules tell you if you’re slowly veering off the road,“ notes Patrick Thoma, PV Process Specialist at PVTestLab. „In high-precision processes like encapsulant curing, that early warning is the difference between a minor adjustment and a major production loss.“
Achieving this level of process intelligence depends on a data-rich environment, where variables can be precisely controlled and their effects measured. This is the foundation of modern, high-yield solar manufacturing.
Frequently Asked Questions (FAQ)
Do I need special software for this?
Not necessarily. While dedicated statistical software makes it easy, you can apply these rules using templates in programs like Microsoft Excel. The most important tool isn’t the software, but your team’s understanding of what the patterns mean.
Isn’t this overkill for a stable process?
No process is perfectly stable forever. Equipment wears, materials vary, and environments change. Nelson Rules are your insurance against the slow, inevitable drifts that affect even the most well-run lines. It’s about maintaining stability, not just achieving it once.
Which Nelson Rule is the most important for lamination?
Trends (Rule 1) and Shifts (Rule 2) are often the most telling for thermal processes. They directly point to gradual equipment wear (a trend) or a sudden change in materials or settings (a shift), both of which are common culprits in lamination issues.
How much data do I need to get started?
A good rule of thumb is to collect at least 20-25 sequential data points from a process you believe to be stable. This gives you a reliable baseline to calculate your initial average and control limits, from which you can start looking for non-random patterns.
Your Next Step: From Theory to Practice
Moving beyond simple control limits gives you a powerful, predictive view of your process health. It allows you to stop firefighting and start fine-tuning.
The next time you look at a run chart, don’t just check if the dots are between the lines. Look for the story they are telling. Are they trending? Have they shifted? Are they oscillating? Answering these questions is the first step toward true process control.
For teams aiming to master these variables and validate new materials or designs in a real-world setting, understanding the fundamentals of process optimization and training is essential for turning data into durable, high-performance solar modules.